

A fool sees not the same tree that a wise man sees.
William Blake, 1790
There are two primary methods used to analyze securities and make investment decisions: fundamental analysis and technical analysis. Fundamental analysis involves analyzing a company’s financial statements to determine the fair value of the business, while technical analysis assumes that a security’s price already reflects all publicly-available information and instead focuses on the statistical analysis of price movements.
The fundamental approach is based on an in-depth and all-around study of the underlying forces of the economy, conducted to provide data that can be used to forecast future prices and market developments. Fundamental analysis can be composed of many different aspects: the analysis of the economy as the whole, the analysis of an industry or that of an individual company. A combination of the data is used to establish the true current value of stocks, to determine whether they are over- or under-valued and to predict the future value of the stocks based on this information.
Much of your success in technical analysis will come from experience. The goal isn’t to find the holy grail of technical analysis, it is to reduce your risks (e.g., by trading with the overall trend) while capitalizing on opportunities (e.g., using your favorite indicator to time your trades). As you gain experience, you will make better, more informed, and more profitable investments.
Short-term traders are less able to benefit from fundamental analysis, but what about long-term investors?
Even if you are an expert who spends 24 hours a day keeping an eye on all the fundamental developments that can influence the market, the reliability of your forecasts will still be relative. Fundamental analysis will probably work most of the time, but there will hardly ever be the possibility of predicting when it’s going to fail. As a result, it is most effective when used over a longer time frame, allowing it to provide a more balanced picture of a company.
The fundamental approach is often used by long-term investors, but it can also be combined with technical analysis to help traders gain insight into the overall state of the market and the attractiveness of a particular security.
The following terms are a collection of definitions that explain most of the vocabulary that any investors or traders should know in order to behave properly and wisely when buying stocks on the market!
Index
A stock’s membership in a major stock exchange index such as Dow Jones Industrial or S&P 500. The stock indices track the performance various segments of the market.
Sector
Companies are divided into several groups – sectors – according to their business activities.
Industry
Companies in a common sector are further divided by products and services into smaller groups – industries.
Country
The geographic location of a company (listed on U.S. markets). This filter includes continents, countries or groups of countries such as Brazil + Russia + India + China (BRIC).
Market Cap.
The total dollar value of all of a company’s outstanding shares. Market capitalization is a measure of corporate size.
Market Capital = Current Market Price * Number Of Shares Outstanding
Shares Outstanding = Total Number Of Shares – Shares Held In Treasury
Float = Shares Outstanding – Insider Shares – Above 5% Owners – Rule 144 Shares
P/E
A popular valuation ratio of a company’s current share price compared to its per-share earnings (trailing twelve months). Low P/E value indicates a stock is relatively cheap compared to its earnings. For instance, a P/E value of 15 means that the current price equals the sum of 15-year earnings per share. The average level varies across the market. Therefore, P/E value should be compared per sector or industry.
P/E = Current Market Price / Earnings Per Share (EPS)
P/E = Average Common Stock Price / Net Income Per Share
EPS = (Net Income – Dividends On Preferred Stock) / Average Outstanding Shares
Forward P/E
A measure of the price-to-earnings ratio using forecasted earnings for the P/E calculation for the next fiscal year. If the earnings are expected to grow in the future, the forward P/E will be lower than the current P/E.
Forward P/E = Current Market Price / Forceasted Earnings Per Share
PEG
A ratio used to determine a stock’s value while taking into account the earnings’ growth. PEG is used to measure a stock’s valuation (P/E) against its projected 3-5 year growth rate. It is favored by many over the price/earnings ratio because it also takes growth into account. A lower PEG ratio indicates that a stock is undervalued.
PEG = (P/E) / Annual EPS Growth
P/S
A ratio that reflects the value placed on sales by the market. It is calculated by dividing the current closing price of the stock by the dollar-sales value per share. The ratio is often used to value unprofitable companies.
P/S = Current Market Price / Total Revenues Per Share
P/B
A ratio used to compare a stock’s market value to its book value. It is calculated by dividing the current closing price of the stock by the latest quarter’s book value per share. A lower P/B ratio could mean that the stock is either undervalued or something is fundamentally wrong with the company.
P/B = Current Market Price / (Total Assets – Total Liabilities)
P/B = Current Market Price / (Total Common Equity / Total Common Shares Outstanding)
Book Value = (Total Assets – Total Liabilities) = Share Holder’s Equity
Price/Cash
A ratio used to compare a stock’s market value to its cash assets. It is calculated by dividing the current closing price of the stock by the latest quarter’s cash per share.
P/C = Current Market Price / Cash per Share
Price/Free Cash Flow
A valuation metric that compares a company’s market price to its level of annual free cash flow.
P/FCF = Current Market Price / Cash Flow per Share
EPS, EPS growth this year
EPS is the portion of a company’s profit allocated to each outstanding share of common stock. EPS serves as an indicator of a company’s profitability and is generally considered to be the single most important variable in determining a share’s price. It is also a major component of the P/E valuation ratio.
EPS = Total Earnings / Total Common Shares Outstanding (trailing twelve months)
EPS = (Net Income – Dividends On Preferred Stock) / Average Outstanding Shares
EPS Growth This Year = (EPS This Year – EPS Previous Year) / EPS Previous Year
EPS growth next year
EPS estimate for the next fiscal year.
EPS growth past 5 years
EPS annual growth over the past 5 fiscal years.
EPS growth next 5 years
EPS annual long-term estimate.
EPS growth qtr over qtr
EPS increase in the last quarter.
Sales growth qtr over qtr
Company’s total revenues increase in the last quarter.
Sales growth past 5 years
Anual sales increase over past 5 years.
Dividend Yield
The dividend yield equals the annual dividend per share divided by the stock’s price. This measurement tells what percentage return a company pays out to shareholders in the form of dividends. Investors who require a minimum stream of cash flow from their investment portfolio can secure this cash flow by investing in stocks paying relatively high, stable dividend yields.
Dividend Yield = Annual Dividend Per Share / Price Per Share
Return on Assets
An indicator of how profitable a company is relative to its total assets. ROA gives an idea as to how efficient management is at using its assets to generate earnings. Calculated by dividing a company’s annual earnings by its total assets, ROA is displayed as a percentage.
ROA = Annual Earnings / Total Assets
Return on Equity
A measure of a corporation’s profitability that reveals how much profit a company generates with the money shareholders have invested. Calculated as Net Income / Shareholder’s Equity.
ROE = Annual Net Income / Share Holder’s Equity
ROE = Annual Net Income / Book Value
ROE = Annual Net Income / (Total Assets – Total Liabilities)
Return on Investment
Performance measure used to evaluate the efficiency of an investment or to compare the efficiency of a number of different investments. To calculate ROI, the benefit (return) of an investment is divided by the cost of the investment.
ROI = (Gain from Investment – Cost of Investment) / Cost of Investment.
Current Ratio
A liquidity ratio that measures a company’s ability to pay short-term obligations. Calculated as Current Assets / Current Liabilities.
Current Ratio = Current Assets / Current Liabilities
Quick Ratio
An indicator of a company’s short-term liquidity. The quick ratio measures a company’s ability to meet its short-term obligations with its most liquid assets. The higher the quick ratio, the better the position of the company. Calculated as (Current Assets – Inventories) / Current Liabilities.
Quick Ratio = (Current Assets – Inventories) / Current Liabilities
Long Term Debt/Equity
A measure of a company’s financial leverage calculated by dividing its long term debt by stockholders’ equity. It indicates what proportion of equity and debt the company is using to finance its assets.
LT Debt/Equity = Long Term Debt / (Share Holder’s Equity)
LT Debt/Equity = Long Term Debt / (Total Assets – Total Liabilities)
LT Debt/Equity = Long Term Debt / (Book Value)
Debt/Equity
A measure of a company’s financial leverage calculated by dividing its liabilities by stockholders’ equity. It indicates what proportion of equity and debt the company is using to finance its assets.
Debt/Equity = Current Liabilities / (Share Holder’s Equity)
Debt/Equity = Current Liabilities / (Total Assets – Total Liabilities)
Debt/Equity = Current Liabilities / (Book Value)

Gross Margin
A company’s total sales revenue minus its cost of goods sold, divided by the total sales revenue, expressed as a percentage. The gross margin represents the percent of total sales revenue that the company retains after incurring the direct costs associated with producing the goods and services sold by a company. The higher the percentage, the more the company retains on each dollar of sales to service its other costs and obligations.
Gross Margin = (Total Sales – Costs) / Total Sales
Operating Margin
Operating margin is a measurement of what proportion of a company’s revenue is left over after paying for variable costs of production such as wages, raw materials, etc. A healthy operating margin is required for a company to be able to pay for its fixed costs, such as interest on debt. Calculated as Operating Income / Net Sales.
Operating Margin = Operating Income / Net Sales
Net Profit Margin
A ratio of profitability calculated as net income divided by revenues, or net profits divided by sales. It measures how much out of every dollar of sales a company actually keeps in earnings.
Net Profit Margin = Net Income / Revenues
Net Profit Margin = Net Profits / Sales
Payout Ratio
The percentage of earnings paid to shareholders in dividends.
Payou Ratio = Dividends / Earnings
Insider Ownership
% of shares currently owned by company management.
Insider Transactions
A company’s shares being purchased or sold by its own management. Value represents % change in total insider ownership.
Institutional Ownership
% of shares currently owned by institutional investors.
Institutional Transactions
A company’s shares being purchased or sold by financial institutions. Value represents % change in total institutional ownership.
Float Short
The number of shares short divided by total amount of shares float, expressed in %.
Analyst Recommendation
An outlook of a stock-market analyst on a stock.
Rating Scale: 1.0 Strong Buy, 2.0 Buy, 3.0 Hold, 4.0 Sell, 5.0 Strong Sell
Option/Short
Stocks with options and/or available to sell short.
Earnings Date
The company’s nearest earnings-report date. The earnings reports of significant companies should also be watched carefully as they may have great influence on the stock market overall.
Performance
% Rate of return for a stock for a given time frame.
Performance values are based on the following time periods:
Performance 1 Week = Last 5 trading days
Performance 1 Month = Last 21 trading days
Performance 3 Months = Last 63 trading days
Performance 6 Months = Last 126 trading days
Performance 1 Year = Last 252 trading days
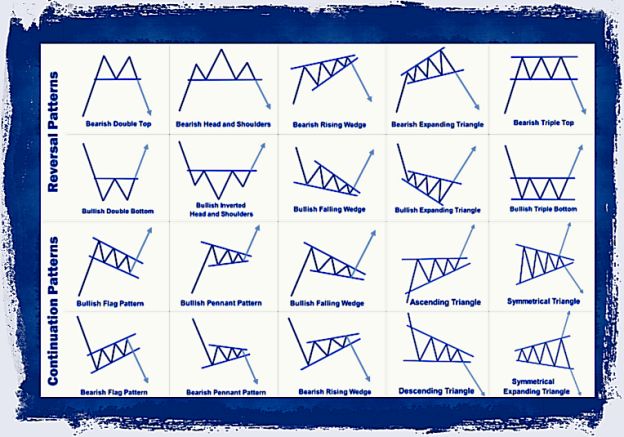
Patterns
A basic principle of technical analysis is that security prices move in trends. We also know that trends do not last forever. They eventually change direction and when they do, they rarely do so on a dime. Instead, prices typically decelerate, pause, and then reverse. These phases occur as investors form new expectations and by doing so, shift the security’s supply/demand lines.
Volatility
A statistical measure of the dispersion of returns for a given stock. Represents average daily high/low % range.
RSI (14)
The Relative Strength Index (RSI) is a technical analysis oscillator showing price strength by comparing upward and downward close-to-close movements. It indicates oversold (buy signal) and overbought (sell signal) price levels for given stock. RS, Average Gain and Average Loss. This RSI calculation is based on 14 periods, which is the default suggested by Wilder in his book. Losses are expressed as positive values, not negative values.
Gap
The difference between yesterday’s closing price and today’s opening price. Gaps indicate either a lack of supply (gap-up) or demand (gap-down), and usually occur after major news events.
Simple Moving Average
Simple Moving Average calculated as an average of the last N-periods (20-Day, 50-Day, 200-Day).
Change
The percentual difference between current close and previous close price.
Change from Open
The percentual difference between current close and today’s open price.
High/Low
Low: Minimum of the lows during last n-periods (20-day, 50-day, 52-week).
High: Maximum of the highs during last n-periods (20-day, 50-day, 52-week).
Filter options represent a percentual distance from the record high/low price.
Support and Resistance
Think of security prices as the result of a head-to-head battle between a bull (the buyer) and a bear (the seller). The bulls push prices higher and the bears push
prices lower. The direction prices actually move reveals who is winning the battle. Support levels indicate the price where the majority of investors believe that
prices will move higher, and resistance levels indicate the price at which a majority of investors feel prices will move lower.
Chart Pattern
A chart pattern is a distinct formation on a stock chart that creates a trading signal, or a sign of future price movements. Chartists use these patterns to identify current trends and trend reversals and to trigger buy and sell signals.
Candle Stick
A candlestick pattern is a distinct formation of the Open, High, Low, and Close prices for given periods of time on a stock chart that creates a trading signal, or a sign of future price movements.
Beta
A measure of a stock’s price volatility relative to the market. An asset with a beta of 0 means that its price is not at all correlated with the market. A positive beta means that the asset generally follows the market. A negative beta shows that the asset inversely follows the market, decreases in value if the market goes up.
ATR
A measure of stock volatility. The Average True Range is a exponential moving average (14-days) of the True Ranges. The range of a day’s trading is high-low, True Range extends it to yesterday’s closing price if it was outside of today’s range.
True Range = max(high,closeprev) – min(low,closeprev).
Average Volume
The average number of shares traded in a security per day, during the recent 3-month period.
Relative Volume
Ratio between current volume and 3-month average value, intraday adjusted.
Relative Volume = Current Volume / 3-month Average Volume
Current Volume
Total number of shares traded for a given stock today, or during the last trading session.
Price
The current stock price or the close price during the last trading session.
Signals
Stocks can be screened by signals – special events – on which traders usually enter or exit positions.
Top Gainers
Stocks with the highest % price gain today. (Top 200 stocks)
Top Losers
Stocks with the highest % price loss today. (Signal: Top 200 stocks)
New High
Stocks making 52-week high today. (Signal: Top 200 stocks)
New Low
Stocks making 52-week low today. (Signal: Top 200 stocks)
Most Volatile
Stocks with the highest widest high/low trading range today. (Signal: Top 200 stocks)
Most Active
Stocks with the highest trading volume today. (Signal: Top 200 stocks)
Unusual Volume
Stocks with unusually high volume today – the highest relative volume ratio. (Signal: Top 200 stocks)
Overbought
Technical analysis term for stocks with extreme price increase over past two weeks calculated by RSI(14) indicator. Generally, this means that a stock is becoming overvalued and may experience a pullback. (Signal: Top 200 stocks)
Oversold
Technical analysis term for stocks with extreme price decrease over past two weeks calculated by RSI(14) indicator. Oversold stocks may represent a buying opportunity for investors. (Signal: 2op 100 stocks)
Downgrades
Stocks downgraded by analysts today. (Signal: All downgraded stocks)
Upgrades
Stocks upgraded by analysts today. (Signal: All upgraded stocks)
Earnings Before
Companies reporting earnings today, before market open. (Signal: All stocks with earnings report before today’s open)
Earnings After
Companies reporting earnings today, after market close. (Signal: All stocks with earnings report after today’s close)
Major News
Stocks with the highest news coverage today. (Signal: Top 20 stocks)
Chart Patterns
The foundation of technical analysis is the chart. There are millions of different investors transacting billions of dollars worth of securities each day and it’s nearly impossible to decipher everyone’s motivations. Chart patterns look at the big picture and help to identify trading signals – or signs of future price movements.
Shares Outstanding
The total number of common shares currently owned by the public.
Shares Outstanding = Total Number Of Shares – Shares Held In Treasury
Shares Float
The total number of common shares currently owned by the public and available to be traded.
Shares Float = Shares Outstanding – Insider Shares – Above 5% Owners – Rule 144 Shares
Time
Much of technical analysis focuses on changes in prices over time. Trading always comes down to timing. Timing is hard to master, but you can still capture significant gains on an ill-timed trade if you follow a few simple rules. The first one is “Slow and Low is the Way to Go”. The second one is “No Stops? Big Problem!”. Finally, using even a simple technical indicator such as RSI can make fundamental strategies much more efficient by improving trade entries. Some of the greatest traders in the world have proven that one does not need to be a great timer to make money in the markets, but by using the techniques discussed above, the chances of success improve dramatically.
Trends
A trend represents a consistent change in prices (i.e., a change in investor expectations). Trends differ from support/resistance levels in that trends represent change, whereas support/resistance levels represent barriers to change.
And last but not least:
Financial Statement Fraud
A lot of Financial Statement Fraud has been accomplished through history; you’ve probably heard of Enron and WorldCom scandals, or about Parmalat and some Italian Banks, but there are a lot of other lesser-known, large-scale frauds. Looking back at Enron, perhaps the company best known for committing accounting fraud, you can see the many methods that were utilized in order to fraudulently improve the appearance of its financial statements. Through the use of off balance sheet special purpose vehicles the firm continued to hide its liabilities and inflate its earnings.
Methods of Financial statement fraud
Financial statement fraud can surface in many different forms, although once deceptive accounting practices are initiated, various systems of manipulation will be utilized to maintain the appearance of sustainability. Common approaches to artificially improving the appearance of the financials include: overstating revenues by recording future expected sales, understating expenses through such means as capitalizing operating expenses, inflating assets’ net worth by knowingly failing to apply an appropriate depreciation schedule, hiding obligations off of the company’s balance sheet and incorrect disclosure of related party transactions and structured finance deals. Another alternative to financial statement fraud involves cookie-jar accounting practices, a procedure by which a firm will understate revenues in one accounting period and maintain them as a reserve for future periods with worse performance. Such procedures remove the appearance of volatility from the operations.
Five basic types of financial statement fraud
According to a study conducted by the Association of Certified Fraud Examiners (ACFE), fraudulent financial statement accounts for approximately 10% of incidents concerning white collar crime, then we can have:
fictitious sales
improper expense recognition
incorrect asset valuation
hidden liabilities and unsuitable disclosures
We suggest these websites if you want and like to find out more about these matters:
Money, wealth, investments news
Jesse Livermore trading lessons
The true words of Jesse Livermore
50 Famous Quotes by Jesse Livermore
Trading-Synthetic-Dictionary.pdf