


Technical Analysis of Stock Trends and a very short introduction to the chart encyclopedia of trading technical analysis from a couple of very famous books.
Technical analysis is a trading tool employed to evaluate securities and attempt to forecast their future movement by analyzing statistics gathered from trading activity, such as price movement and volume. Unlike fundamental analysts who attempt to evaluate a security’s intrinsic value, technical analysts focus on charts of price movement and various analytical tools to evaluate a security’s strength or weakness and forecast future price changes.
Finance and trading
Japanese rice trader Munehisa Homma. He lived from 1724 to 1803 and even if half of the legends about him are true, he was by far one of the most amazing traders in history and we can learn a lot from the stories that surround him. Homma is rumored to have made the equivalent of $10 billion in today’s dollars trading in the Japanese rice markets.
In fact, he was such a skilled trader that he served as an important financial advisor to the Japanese government at the time and was later raised to the rank of honorary Samurai. I don’t know about you, but I think it’s pretty safe to say we can learn something from a guy who was such a great trader that he become a Samurai because of it, to me that is totally cool in what is probably a semi-nerdy kind of way.
Rumor has it that he once had 100 profitable trades in a row… granted there’s a bit of an advantage when you are basically the “inventor” of technical analysis and no one else really knows about it yet… but clearly Homma was a force to be reckoned with in the markets and his legend lives on today.
Homma began recording price movements in the rice market on paper made out of rice plants. He laboriously drew price patterns on his rice parchment paper every day, recording the open, high, low and close of each day. Homma began seeing patterns and repetitive signals in the price bars he was drawing and soon started to give them names, including some of the popular Japanese candlestick patterns that you are probably already familiar with like Spinning tops, Stars, Doji’s, Hanging Man and others, each pattern clearly conveyed a specific meaning and Homma began using these patterns to predict the future direction of rice prices.
The discovery of the price action patterns left behind by the movement of rice prices gave Homma a huge advantage over other traders in his day, and combined with his passion and skill for trading, this advantage is what allowed him to become one of the most successful traders ever, if not thee most successful trader ever.
Nial Fuller
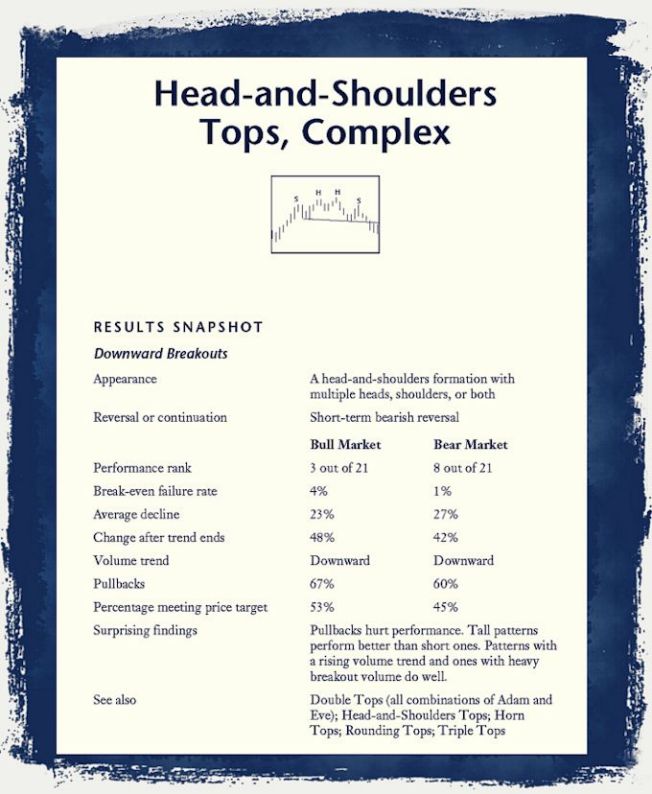
I cannot give you the experience needed to make money in the stock market using chart patterns. I can only give you the tools and say, “Go to work on paper first.” That is the first step in developing a trading style that works for you, one you are comfortable with, one that improves as you do.
If you review your paper trades, you will understand why a stop-loss order is more than a tool for the professionals. You will improve your ability to predict support and resistance levels that will, in turn, allow you to tighten your stops and get out near the top, cut your losses short, and let your profits run. You will understand why the statistics in this book are useful for comparison purposes, but your trading results may fall short. You may discover that your girlfriend loves diamonds, but as a chart pattern, they are a lousy investment. One word says it all. Experience. Good luck.
Thomas N. Bulkowski from the book Encyclopedia of Chart Patterns
The Technical Approach to Trading and Investing. A brief introduction.
As Freud mapped the human psyche, so have Edwards and Magee mapped the human mind and emotions as expressed in the financial markets. Not only did they produce a definitive map, they also produced a methodology for interpreting and profiting from the behavior of men and markets.
Few human activities have been so exhaustively studied during the past century, from so many angles and by so many different sorts of people, as has the buying and selling of corporate securities. The rewards which the stock market holds out to those who read it right are enormous; the penalties it exacts from careless, dozing, or “unlucky” investors are calamitous. No wonder it has attracted some of the world’s most astute accountants, analysts, and researchers, along with a motley crew of eccentrics, mystics, and “hunch players,” and a multitude of just ordinary hopeful citizens.
Able brains have sought, and continue constantly to seek, for safe and sure methods of appraising the state and trend of the market, of discovering the right stock to buy and the right time to buy it. This intensive research has not been fruitless – far from it. There are a great many successful investors and speculators (using the word in its true sense, which is without opprobrium) who, by one road or another, have acquired the necessary insight into the forces with which they deal and the judgment, the forethought, and the all important self-discipline to deal with them profitably.
In the course of years of stock market study, two quite distinct schools of thought have arisen, two radically different methods of arriving at the answers to the trader’s problem of what and when. In the parlance of “the Street,” one of these is commonly referred to as the fundamental or statistical, and the other as the technical. (In recent years a third approach, the cyclical, has made rapid progress and, although still beset by a “lunatic fringe,” it promises to contribute a great deal to our understanding of economic trends.)
The stock market fundamentalist depends on statistics. He examines the auditors’ reports, the profit-and-loss statements, the quarterly balance sheets, the dividend records, and policies of the companies whose shares he has under observation. He analyzes sales data, managerial ability, plant capacity, the competition.
He turns to bank and treasury reports, production indexes, price statistics, and crop forecasts to gauge the state of business in general, and reads the daily news carefully to arrive at an estimate of future business conditions. Taking all these into account, he evaluates his stock; if it is selling currently below his appraisal, he regards it as a buy.
More than 100 years ago, in Springfield, MA, there lived a man named Charles H. Dow. He was one of the editors of a great newspaper, The Springfield Republican. When he left Springfield, it was to establish another great newspaper, The Wall Street Journal. Charles Dow also laid the foundation for a new approach to stock market problems. In 1884, he made up an average of the daily closing prices of 11 important stocks, 9 of which were rails, and recorded the fluctuations of this average. He believed that the judgment of the investing public, as reflected in the movements of stock prices, represented an evaluation of the future probabilities affecting the various industries.
He saw in his average a tool for predicting business conditions many months ahead. This was true because those who bought and sold these stocks included people intimately acquainted with the industrial situation from every angle. Dow reasoned that the price of a security, as determined by a free competitive market, represented the composite knowledge and appraisal of everyone interested in that security – financiers, officers of the company, investors, employees, customers – everyone, in fact, who might be buying or selling stock.
The term “technical,” in its application to the stock market, has come to have a very special meaning, quite different from its ordinary dictionary definition. It refers to the study of the action of the market itself as opposed to the study of the goods in which the market deals. Technical Analysis is the science of recording, usually in graphic form, the actual history of trading (price changes, volume of transactions, etc.) in a certain stock or in “the Averages” and then deducing from that pictured history the probable future trend.
Chart formations are the language of the market, telling us that this stock is in its death throes; that stock is on a rocket to the moon; that a life and death battle is being waged in this issue; and in that other, the buyers have defeated the sellers and are breaking away. They are the depiction of multifarious human actions bearing on a single variable (price).
On price converge a galaxy of influences: fear, greed, desire, cunning, malice, deceit, naiveté, earnings estimates, broker need for income, gullibility, professional money managers’ need for performance and job security, supply and demand of stocks, monetary liquidity and money flow, selfdestructiveness, passivity, trap setting, manipulation, blind arrogance, conspiracy and fraud and double dealing, phases of the moon and sun spots, economic cycles and beliefs about them, public mood, and the indomitable human need to be right.
From the book Technical Analysis of Stock Trends by Robert D. Edwards John Magee W.H.C. Bassetti

Money, wealth, investments news
Jesse Livermore trading lessons
The true words of Jesse Livermore
50 Famous Quotes by Jesse Livermore